Lab 6: CDMA - INTRODUCTION AND PROCESSING GAIN
Extra modules needed:
ADDER, MULTIPLIER, SEQUENCE GENERATOR, AUDIO OSCILLATOR, CDMA DECODER, DIGITAL UTILITIES, MULTIPLE SEQUENCES SOURCE, NOISE GENERATOR, TUNEABLE LPF, 60 kHz LPF, WIDEBAND TRUE RMS METER and VCO (for NOISE GENERATOR bandwidth measurement)
PREPARATION
Two advanced modules are available for modelling a code division multiple access
(CDMA) system. This experiment introduces these modules in a direct sequence spread spectrum (DSSS) single channel
arrangement, which serves as an introduction to later CDMA experiments.
The DSSS system is illustrated in Figure 1. The adder represents the transmission path. Noise or interference can be inserted at this point to demonstrate some properties of spread spectrum.
The message sequence is at a bit rate considerably lower then that of the spreading pseudonoise (PN) sequence. Modulation of the spreading sequence by the message sequence is implemented with an X-OR gate (effectively this is a binary multiplication). The ratio of the bit rates has a bearing on the coding gain, to be investigated in a later Lab Sheet.
Figure 1: System block diagram
After transmission, decoding (demodulation) is performed at the receiver by multiplying the received DSSS with a replica of the modulating spreading sequence at the transmitter. To simplify the system the clock and alignment signal for the local demodulation sequence are stolen from the transmitter.
In the demodulation (or de-spreading process) the message sequence is collapsed back into its original bandwidth, and unwanted components such as noise and interference are spread in the same process. The LPF allows the desired recovered message to pass, and suppresses the unwanted noise and interference that have been spread by the demodulator.
Experiment
The block diagram of Figure 1 is shown modelled in Figure 2.
Read about the MULTIPLE SEQUENCES SOURCE and CDMA DECODER modules in the Appendix. Before plugging them in set the on-board rotary switches to select identical, long sequences.
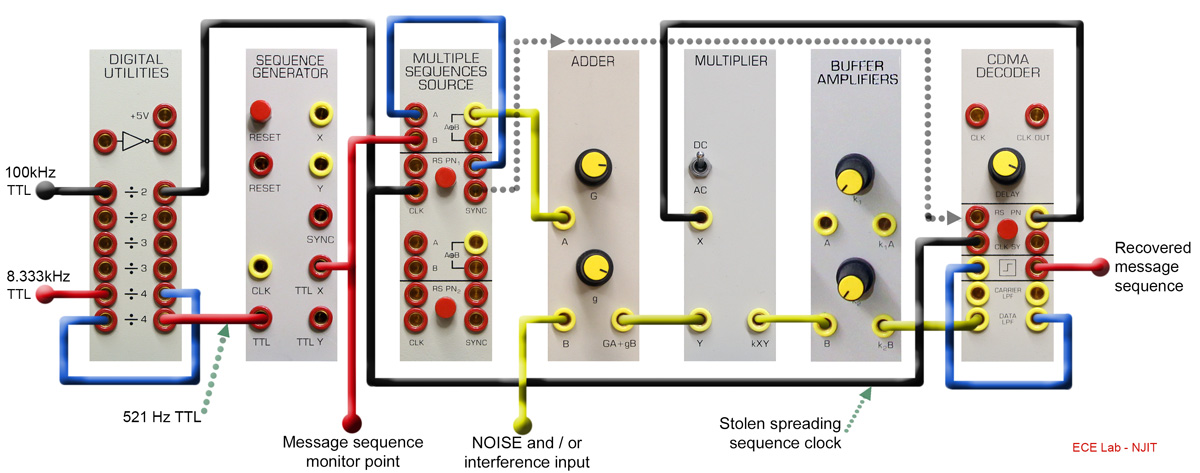
Figure 2: System model
For ease of viewing, use a short sequence for the message. Check clock frequencies as patching proceeds. Set the level of the DSSS from the ADDER to the TIMS ANALOG REFERENCE LEVEL (2 volt peak). The BUFFER AMPLIFIER serves to invert the signal; set its gain to about unity. Synchronise the oscilloscope to the message SYNCH signal. Display the source message sequence.
Simultaneously observe the output from the ‘recovered message sequence’ socket. Unless the two spreading PN sequences are aligned, the source message will not be recovered. Align these two sequences (for sequence alignment refer to the Lab Sheet entitled PRBS messages). Although their alignment cannot (easily) be confirmed by direct oscilloscope observation (why ?), an indirect (and reliable) method is to watch the source and recovered message sequences. Confirm that message recovery has been achieved.
Things to look into
Having satisfied yourself that the message has been recovered there are many interesting things you can try. For example:
- Upset the de-spreading sequence alignment (press reset of either PN generator)
- Use short PN sequences
- Add sinewave interfering (jamming) signals and observe their effect at the DATA LPF output (the unwanted components look like noise)
- Repeat the sinewave interference test for different spreading sequence bit rate and sinewave amplitudes note the qualitative effect upon the SNR (divide the 100 kHz for lower spreading frequencies, or use the VCO in FSK mode to go higher)
- In the previous item replace the sine wave with filtered noise.
Conclusion
Following this introductory qualitative experiment you will be ready for quantitative investigations in the Lab Sheet entitled DSSS - processing gain. Then, in the Lab Sheet entitled CDMA - 2 channel, and CDMA - multichannel, more channels are added to model a CDMA system.
CDMA - PROCESSING GAIN
PREPARATION
You have shown qualitatively that with spread spectrum modulation a relatively clean message can be recovered in the presence of high levels of noise and interference. This comes about as a result of the bandwidth-SNR exchange in the demodulator, reaping a significant SNR improvement. This improvement is referred to as the processing gain. The qualitative observations you have performed are now extended to quantitatively assess the relationship between spreading bandwidth and SNR improvement.
The processing gain is normally expressed in dB. It indicates the additional noise that can be tolerated compared to a system that does not use spread spectrum.
Experiment
For a block diagram of the DSSS system refer to the Lab Sheet entitled CDMA - introduction. The patching diagram is repeated below.
Figure 1: DSSS patching diagram
Patch up the system as per Figure 1. Use a short sequence for the message (ease of viewing) and a long spreading sequence. Align the two PN sequences, and confirm the source and recovered message sequences are identical.
Interference
In a CDMA system interference comes from many sources (including, of course, other channels, which introduce ‘co-channel’ interference). Add a single sinusoidal interfering signal. Do this by connecting a sinewave (say 2 kHz from an AUDIO OSCILLATOR) to the spare input of the ADDER.
Set the interfering and wanted signals to equal amplitudes at the ADDER output. Adjust levels at analog module inputs to safely below their overload point (ie, to the TIMS ANALOG REFERENCE LEVEL).
Start with a high spreading sequence clock rate, say 800 kHz*. Remove the wanted signal from the ADDER, and measure the noise level at the output of the data filter, using the WIDEBAND TRUE RMS METER.
Use the DIGITAL UTILITIES module to reduce the clock rate by an octave at a time. From 100 kHz down use the 100 kHz from MASTER SIGNALS as the source. Reducing the clock rate will reduce the bandwidth of the spreading sequence. Show that the unwanted (noise) output power changes in inverse proportion. Make a table showing the noise power changes (in dB) versus relative PN bandwidth.
As the interfering signal is added and removed, observe the effect upon the signal at both the input and the output of the DATA LPF, and the limiter/comparator output.
Repeat the previous procedure, this time measuring the message output power. Show this is independent of the spreading sequence bandwidth.
Repeat the above, this time using a higher interfering frequency - say 10 kHz. Report and explain differences, if any.
Repeat the above measurements, this time using noise from the NOISE GENERATOR instead of the single tone.
Did the noise power (increase) finally reach a plateau below a certain clock rate ? If so, why ? What was the noise bandwidth?
Repeat again, this time using lowpass filtered (60 kHz LPF) noise. Where is the plateau now? The effect is due to the fact that the spreading sequence clock rate has been reduced below the bandwidth of the noise. Explain the change.
Using a lowpass filter of known bandwidth, can you measure/estimate the bandwidth of the noise from the NOISE GENERATOR? First check the bandwidth of the 60 kHz LPF (use the VCO).
The above observations will have given you an understanding of the phenomenon of spreading the signal and obtaining in return a useful processing gain.
To follow
In a following Lab Sheet, entitled CDMA - 2 channel, the effects of co-channel interference will be examined.