Part B - Semiconductor Devices
Experiment Series 2 – Diodes 2
Diodes 2 Prelab Assignment
- What determines the light spectrum of LED?
- What is the relation between LED current and the light intensity? Explain why.
Reference: E. Fred Schubert, Light-Emitting Diodes 2nd Edition 2006. pp. 87-97.
Experiments with Semiconductor Diodes
- LEDs. Measure forward bias characteristics of two LEDs of different color (red and green or blue) using Agilent source measure unit. Concentrate on the forward bias at low current ≤ 1 mA to determine the saturation current and the ideality factor. At a higher current the I-V characteristic may diverge form the exponential function and show the effect of the series resistance. Note the current and voltage at which the diode starts emitting light.
- Electroluminescence spectra of the LED devices. Measure electroluminescence spectra of three different LEDs (green, blue and red or green, red and white) at three different DC biasing conditions and currents (10mA, 50mA and 100mA). Light from the LEDs will be collected by an optical fiber and analyzed using an Ocean Optics spectrometer (USB 2000). Plot these spectra in the same graph.
-
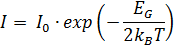
Temperature dependence of the diode reverse bias current. Using a temperature controlled hot plate, measure the reverse bias current at VD = -15 V as a function of temperature. The diode must be in contact with the hot plate, pressed against it with thermally insulating material, such as Styrofoam. Perform measurements in temperature range 40° C to 100° C, approximately every 10° C. Increase the temperature dial very slowly; once you overshoot the desired value the plate takes time to cool down. Let the temperature settle at the preset value, as it stabilizes so does the diode current. Plot ln(ID) vs. 1/T(K) and find if this data follows the equation shown below. From the graph find the value of EG. What is the meaning of this parameter?
Plot I-V curves of these LEDs and the I-V curve of one diode measured in LAB 1 in the same graph.
Report and Analysis
Present clearly all schematics of the experimental circuits. Show all relevant clearly labeled graphs and include data tables but not large spreadsheets from the Agilent unit. The data tables must have titles indicating to which measurements they refer. Extract parameters of the diodes: saturation current, ideality factor, and when possible equivalent series and shunt resistances from measurements 1. The values of the parameters must be clearly related to the graphs of the data and trend lines form which they were derived. Make a summary table listing all measured diodes and their derived parameters including those in Diodes 1 experiments.
Calculate EG from measurements 3.
Points to discuss
- Are the values of the derived parameters reasonable, in agreement with your understanding of the measured devices?
- What is a major difference between forward bias characteristics of the silicon diodes measured in Diodes 1 experiments and the two LEDs? For comparison, plot them on the same linear graph. What explains the difference between these characteristics?
- Explain the differences in the electroluminescence spectra of the three LEDs. Note the peak emission wavelength and FWHM (full width at half maximum) of each spectrum. Comment on the importance of FWHM of the electroluminescence spectra.
- What is the meaning of EG derived from measurements 3. Is the measured value of EG close to what you expected it to be?
You may add any other comments and interesting observations from the experiments.